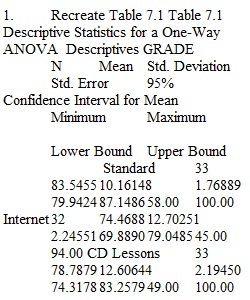
Q Weekly Challenge Activity Assignment - 10 POINTS Written Assignment Click for more options The weekly challenge activity assignments are intended to give you practice on the concepts that are covered during the week. They provide you with a learning-by-doing opportunity to ensure that you develop essential skills needed to understand the course material in subsequent weeks and to complete the Homework Assignment. If you encounter any difficulties with these activities, make sure that you seek guidance from your instructor. To complete these exercises, you will need to use the following data sets; which are provided in IBM SPSS format. Data files: COURSES.SAV TREND.SAV DISPLAY.SAV Using Quick Guide to IBM SPSS by Example: Statistical Analysis with step-by-step examples. Complete the following activities: One-Way ANOVA section - Chapter 7, Examples 7.1 and 7.2 1. Recreate Table 7.1 2. Recreate Table 7.2 3. Recreate Table 7.3 4. Recreate Table 7.4 5. Recreate Table 7.5 6. Recreate Table 7.6 7. Reproduce Figure 7.5 8. Recreate Table 7.8 Two-Way ANOVA section -- Chapter 7, Example 7.3 9. Recreate Table 7.10 10. Recreate Table 7.11 11. Reproduce Figure 7.9 12. Recreate Table 7.12 13. Recreate Table 7.13 (Note: Table 7.13 is created in Word, using data from Table 7.10) Save the syntax files used to produce these figures and tables. Submit the syntax files for grading. Copy the figures and tables to a Word document making sure that you are using APA style formatting for the titles of the tables and figures. Submit the Word file for grading. syntax files 1 Word file. Assignment Grading Rubric Click on the link to view the grading rubric for this assignment: Assignment Rubric Directions for Submission: Submit your all your work through the single Assignments link Submit your assignment via the left-hand navigation menu no later than 11:59 ET on Day 7.
View Related Questions